The SAN and NAS management is done by another team and we had to pinpoint the problem to convince them that it was really an I/O issue. So how exactly do you do this on a server with several databases and processes?
Off to my favorite developer Bregt, I knew he had good knowledge of WinDbg so he could help us pinpoint the issue. Lucky for me Bregt is a nice guy and he explained to me how I could find the cause of the crash.
Download WinDbg which is part of the debugging toolkit provided by Microsoft.
Start WinDbg (Run As Administrator in Vista) and configure the symbols as follows (CTRL-S)
 The url can be found in the WinDbg help and the local symbols path is one you choose (and create yourself). Don't forget to save your workspace when it asks you to (thanks again Bregt).
After you have done this you can open a crash dump (CTRL-D), this might take a while depending on the size of the dump.
Type ~kv in the command line, this gives you the call stack with the memory addresses.
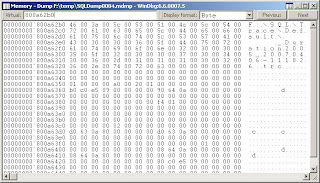
Using ALT-5 you get a memory viewer, here you can check the content of the memory for the last call. It is possible however that nothing is returned for the memory address since not everything is dumped with a minidump. In our case this was "ntdll!ZwCreateFile+0xa" and this directed us to the exact filename and it was a server side trace that was being saved to a NAS drive.
How cool is that?
I feel like digging a little deeper in WinDbg when I find some time. A colleague of us (Hans De Smaele) has written a great document on this topic.

No comments:
Post a Comment